Showing posts with label Irish bonds portfolio. Show all posts

Tuesday, October 5, 2010

Economics 5/10/10: Irish bonds - ECB propping Leni up, for now

Irish bonds have been performing quite strongly in the last few days, following last Thursday desperate news on banks recapitalizations. What gives, one might ask? Was the certainty of Ireland posting a historical record-breaking 32% budget deficit this year better than the uncertainty of previous estimates? Or was it something else.

Given the opacity of the sovereign bond markets - especially for countries like Ireland (note the farce here - Government own securities exist in a world of much more restricted newsflows than ordinary equities, and yet everyone today expects Governments to lead in a charge for greater transparency and regulation) - one finds it difficult to explain what has been happening here.

Two possible contributing factors emerged in recent days to at leats partially account for strong performance:
  1. ECB buying Irish bonds; and
  2. Short positions being rolled up in profit taking
Now, we have some confirmation to (1). FT Deutschland reports today that last week ECB has dramatically increased purchases of Greek, Spanish and Irish bonds, having bough ca €1.384 billion worth of stuff in one week, and bringing its total holdings to €63.5bn. The weekly ramp up was some ten-fold on €134 million of same bonds purchased in the last week of September. ECB now holds some 14% of the entire sovereign debt market in Greek, Spanish and Irish bonds. This implies that market valuations in these bonds are entirely bogus.

FT Alphaville has a few charts on both Irish & Portuguese markets (here).

Which brings us to the shorts closures. Holding an open and backdated short position in the paper artificially propped up by the ECB is like taking a proverbial p**ss into the gale force wind storm. Given that most shorts against Irish debt were written around mid- to late-August, this was clearly the time to book some profits. Which, of course, further pushed up demand for these bonds and thus prices. Yields compressed down.

But the question next is: where does the freed up cash flow now? Most likely, the markets will pause to see whether the ECB latest purchasing is going to continue. If so, expect another rise in prices and a waiting game, as markets participants would rationally expect the ECB to start unwinding new purchases in a couple of weeks time. Once that move is seen on the horizon, new shorts will be taken, once again.

Tuesday, September 21, 2010

Economics 21/9/10: This Little PIIGSy Went to the Market

So here we go again: NTMA went to the market, ECB came along, the results are suspiciously identical (save for obviously increased costs of borrowing) to those achieved in August.

We sold €500 million of 4 year debt due in 2014 at an average yield of 4.767%, compared with 3.627 percent at the previous auction on August 17. Cover on 4 year paper was We also sold €1 billion wort of 8 year paper due in 2018 a yield of 6.023%, up from 5.088% in a June sale.

Short term stuff first:
Cover support is clearly running well above average/trend, indicating potential engagement by the ECB. Price spread is down, suggesting that the yields achieved are reflective in the perceptions compression on behalf of bidders, which in turn might mean that the markets are getting more comfortable with higher risk pricing of Irish bonds.

Next up: yields and prices achieved:
The dynamics are crystal clear - we are heading for a new territory in terms of elevated yields and lower prices. Actually, setting historical record in both, despite likely ECB interventions.

Weighted average accepted price:
Boom! The curve is getting curvier.

On to longer term stuff:
Yield spread down as well - same reason - higher yields are now a 'normal' for the markets as average accepted yield shot up.
Cover slightly up, perhaps being pushed by the bidders flowing from the shorter term paper - crowded out by Jean Claude Trichet's boys. Price spread is down (see yield spread discussion above).

Predictably, longer-term accepted average price is testing historical lows:
Boom, redux!

And the maturity profile of debt is getting steeper for the folks who'll take over the Government in the next round, and our teenagers (that'll teach'em a lesson, for those, of course who'll stay on these shores):

Monday, August 23, 2010

Economics 23/8/10: ECB & IRL bonds

Per report today: "FRANKFURT, Aug 23 (Reuters) - The ECB said on Monday it bought and settled €338mln worth of bonds last week, the highest amount since early July and bolstering recent market talk it had ramped up purchases of Irish bonds. The amount is well above €10mln of purchases settled the previous week... It follows recent comments by market participants that the ECB bought 60 million euros of 2012 Irish government bonds just over a week ago, after spreads over German Bunds ballooned. The ECB has not given any details of its bond buying."

I speculated after last auction results were announced by the NTMA that extraordinary level of cover (x5.4) on 4 year bonds issue looked strange and that ECB buying might be the case. To remind you - NTMA sold €500mln of 4-year bonds. It now appears that the ECB did indeed engage in potentially substantial buying of Irish bonds. If so, such buying cold have
  1. pushed other purchasers out of the shorter term paper into 10 year bonds; and/or
  2. pushed yields on both shorter and longer term paper down.
€338mln figure includes trades executed between August 12 and August 14 - the auction of shorter term paper that is known to have involved ECB buying.

All in, we are clearly now in the yields zone where the markets are happy to watch us lean on ECB, the ECB is happy to watch us skip one-legged across budgetary deficit that keeps opening up wider and wider. Clearly, such an equilibrium is unlikely to be stable. Expect some fireworks once markets come back to full swing a week from now.

Tuesday, August 17, 2010

Economics 18/8/10: NTMA's foray into bond markets wilderness

As promised - a more in-depth analysis of today's data from NTMA auction.

"The Gruffalo said that no gruffalo should
Ever set foot
In the deep dark wood"

Clearly, bent on saving nation's face, the NTMA could not pass on going to the markets today.

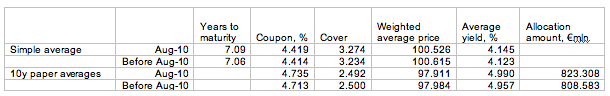
First, let us take a look at the changes in averages from April 2009 first auction through today, against the same averages for the period excluding today's auction.
So today’s auctions have led to:
  • a small increase in overall maturity profile of Irish debt (good news)
  • a small increase in average coupon paid for all maturities (true future liabilities on debt)
  • a modest rise in average cover (potentially due to massive overbidding by ECB, but this is a speculative remark at this moment in time)
  • a drop in average price paid and a corresponding rise in the weighted average yield.
These effects were most discernible in the benchmark 10 year bonds issue, where:
  • Average coupon rose by ca ½ basis point;
  • Average cover dropped
  • Weighted average price declined and weighted average yield rose (the latter by almost 0.7%)
  • Average allocation amount rose.

Even more interesting stats are in the price and yield spreads:
Again, for across all issues averages spreads in prices rose significantly – by 8.3% and spreads in yields rose 7.85%. This is on the back of 10 year paper alone, suggesting the following two things:
  1. Whatever was happening in the shorter term paper market (cover and lower yields) appears to be disconnected from what was going on in longer term paper markets (perhaps the rumoured ECB intervention on the shorter side was after all true?);
  2. Since the prices and yields reflect bids by market makers – the widening of the spreads between max and min bids might be indicative of the markets inability to tightly price Irish sovereign risk. In other words, this might signal general markets uneasiness about the bonds.

Some charts illustrate more general trends.

Short term paper auctions first (5 years and less):
Average yield is still on the rising trend despite a clearly 'extraordinary' move down in today's auction. Even steeper upward trend for November 2009-present is still present. Yield spreads are on the upward move again once more signaling potential rise in overall market skepticism.
Price spread trends up predictably in line with yield spread trend. To see it in absolute terms:
Weighted average price achieved in the auctions:
Again, if ECB speculations play out to be true, the small uptick in price in last auction can be written off completely.

Now to longer maturity (10 years and above).
Average yield down, but still above long term trend. Yield spreads up, quite significantly. As I mentioned in the earlier post, latest auction produced yield spreads of 9.9bps - third highest spread since April 2009.
Price spreads are 75bps - second highest spread since April 2009. Cover down - lowest since February 2009 and is down year on year. Again, to highlight spreads in real terms:
Next, look at the price achieved:
This hardly constitutes any sort of 'success'. May be, just may be - some sort of a stabilization, with mean reversion still incomplete.

Now to the maturity profile of our debt:
We keep on loading the 2014 end of the spectrum - bang on for the year when we are supposed to reach 3% deficit. Of course, with already close to €5 billion in rollovers due in 2014, it's hard to imagine how this is going to help our fiscal position.

Economics 17/8/10: Another 'success' marks NTMA's foray into bond markets wilderness

Wall Street Journal blogs have beat me to the analysis of our NTMA results. Four reasons can explain this blogs tardiness:
  1. I was doing Drivetime commentary on the results at 5:15pm today;
  2. I was finishing my article on the topic for the Irish Examiner tomorrow;
  3. Call of work duty had shifted me firmly for a few hours into a beautiful world of international macro data (oh, the place where there are no Anglos and INBSs... at least not after FDIC gone through their equivalents with a sledge hammer);
  4. Last, but not least, my son gave me an even more important task of playing with him Garda and Helicopter rescue of a Big Black Spider.
To atone for this, this post precludes my deeper analysis of today' NTMA results. This post is a verbatim reply to Wall Street Journal blog post (linked here).

"Dear Richard,

I appreciate the short-term analysis span you deployed in your article on the latest Irish bonds auction.

However, several points worth raising in relation to the claimed 'success' of today's
NTMA placement.

  1. the auction achieved price bid spreads of 75bps - 2nd highest in the last 2 years, suggesting that 'success' was based on a rather less consensus-driven pricing with market makers (traditionally most stable pricing players in the market) having shown significant differences in their ability to price Irish sovereign risk;
  2. the weighted average yield achieved was the 3rd highest over the entire 2009-2010 period of issuance of 10 year bonds; and
  3. cover achieved in 10 year paper auction was lower than a year ago (down to 2.4 from 2.7)

However, it is the longer term issues, that are certainly worth highlighting.

These involve the fact that even under Government own projections, factoring in expected Nama losses forecast by independent analysts, such as myself, Peter Mathews, Prof Brian Lucey and Prof Karl Whelan, by 2012 Ireland will be carrying over 210 billion worth of state (sovereign and quasi-sovereign) debt on its books. At 5.386% yield, this translates into ca €11.31 billion in interest payments alone or more than 1/3 of the entire tax revenue collected by the Irish Government in 2009.

It is naive to believe that 2010 gargantuan deficit in excess of 20% of GDP is a 'one-off' reflection of banks recapitalizations demand.

Again, based on balance sheet analysis, I expect 6 banks covered by the State Guarantee to incur loans losses of ca €50 billion between 2008 and 2012. Current provisions announced by the Irish Government and the banks cover roughly a half of these. The rest will have to be financed out of taxpayers funds in years to come.

In a taste of things ahead, earlier today Governor of the Central Bank has stated that next stage
recapitalization of Irish Nationwide and EBS building societies will cost taxpayers not €3.5 billion earlier factored in by the Minister for Finance, but €4 billion. €500 mln discrepancy within 5 months is a pittance for the Exchequer burning deficits at 20% of GDP (or roughly a quarter of the real domestic economy), but... Independent estimates put the final figure at €7 billion.

So much for the 'one-off measures'.

Perhaps the most telling sign of what is really happening in the markets NTMA tapped today is the fact that having dropped 20bps, Irish bonds spreads over German 10-year bund have risen once again to within a hair of 300bps.

Some success, then..."

In addition, one can only speculate whether the 'spectacularly' large cover of 5.4 for shorter term 4 year paper is due to the much speculated about, but yet to be confirmed or denied, direct buying by the ECB. If so, then we might have a situation where ECB gross over-bidding in the shorter maturity paper placement drove buyers into longer term paper. this, in turn would imply that neither the 3.627% weighted average yield achieved in 4 year bonds nor the 5.386% average yield priced in 10 year bonds are to be trusted as market benchmarks.


A more detailed analysis of the bonds issuance follows in the next post, so stay tuned.

Saturday, October 31, 2009

Economics 31/10/2009: Latest data on Irish Resident Foreign Assets Holdings

CSO released (yesterday) latest data on Resident Holdings of Foreign Portfolio Securities. Charts below illustrate the trends.

First the aggregate stuff:
Notice that 2006-2007 overall trend implies peaking of foreign assets holdings by Irish residents at 2007, and a decline in asset holdings in 2008 to the levels below those recorded in December 2006. This is clearly reflective of the general external crisis in asset markets and is expected to record even further and more dramatic deterioration in 2009. Holdings of bonds and notes also declined from a peak on 2007, but less dramatically in relative terms - reflective of flight to safety into public debt markets by many investors. Again, similar trend to global. Equity holdings took the most sever beating, in line with global markets.

One interesting point is that Money Markets instruments holdings (not plotted above) have also declined in 2007 and 2008. This suggests two idiosyncratic developments in Ireland:
  • risk reductions took place in 2007, well before the full-blown global crisis of 2008, but in line with a financial markets crunch that began in August 2007;
  • both cash and equities were likely to have been used by Irish residents to offset leveraged losses (these are the most liquid instruments that can be used readily to meet margin calls) and this process was on-going in 2007, suggesting serious leveraging exposure to derivatives markets in Irish resident portfolios - a conclusion that would time declines in money markets instruments back to August 2007, when derivatives markets collapse triggered subsequent run on equities).
Now to some more detailed sub-categories of assets. Starting with total foreign asset holdings by country of asset origin:
There is a clear indication here that Irish resident portfolia are heavily geared toward UK and US assets (nothing surprising, as these allocations are only slightly ahead of global diversified portoflia bias toward these two countries). There is also present a relatively heavy allocation bias toward European and EEC securities. However, the real area of geographic diversification imbalance is found amongst the middle income (BRICs) and emerging markets allocations.

Ditto for bonds and Notes:
In terms of Equity allocations:
There is a clear imbalance in Irish resident positions with equity exposure to only a select subset of OECD economies. There is virtually no presence of high growth economies in the overall equity portfolios in Ireland.